> ## Documentation Index
> Fetch the complete documentation index at: https://statsig-4b2ff144-mintlify-java-core-statsig-options-migrati.mintlify.site/llms.txt
> Use this file to discover all available pages before exploring further.
# Creating Metric Tags
> Organize and group your metrics using tags to create collections for easier experiment analysis and monitoring.
# Tagging Metrics
To create a metric tag, click on **Metrics** in the left hand navigation menu, and click on the [Metrics Catalog](https://console.statsig.com/4TLCtqzctSqusYcQljJLJE/metrics/metrics_catalog) tab.
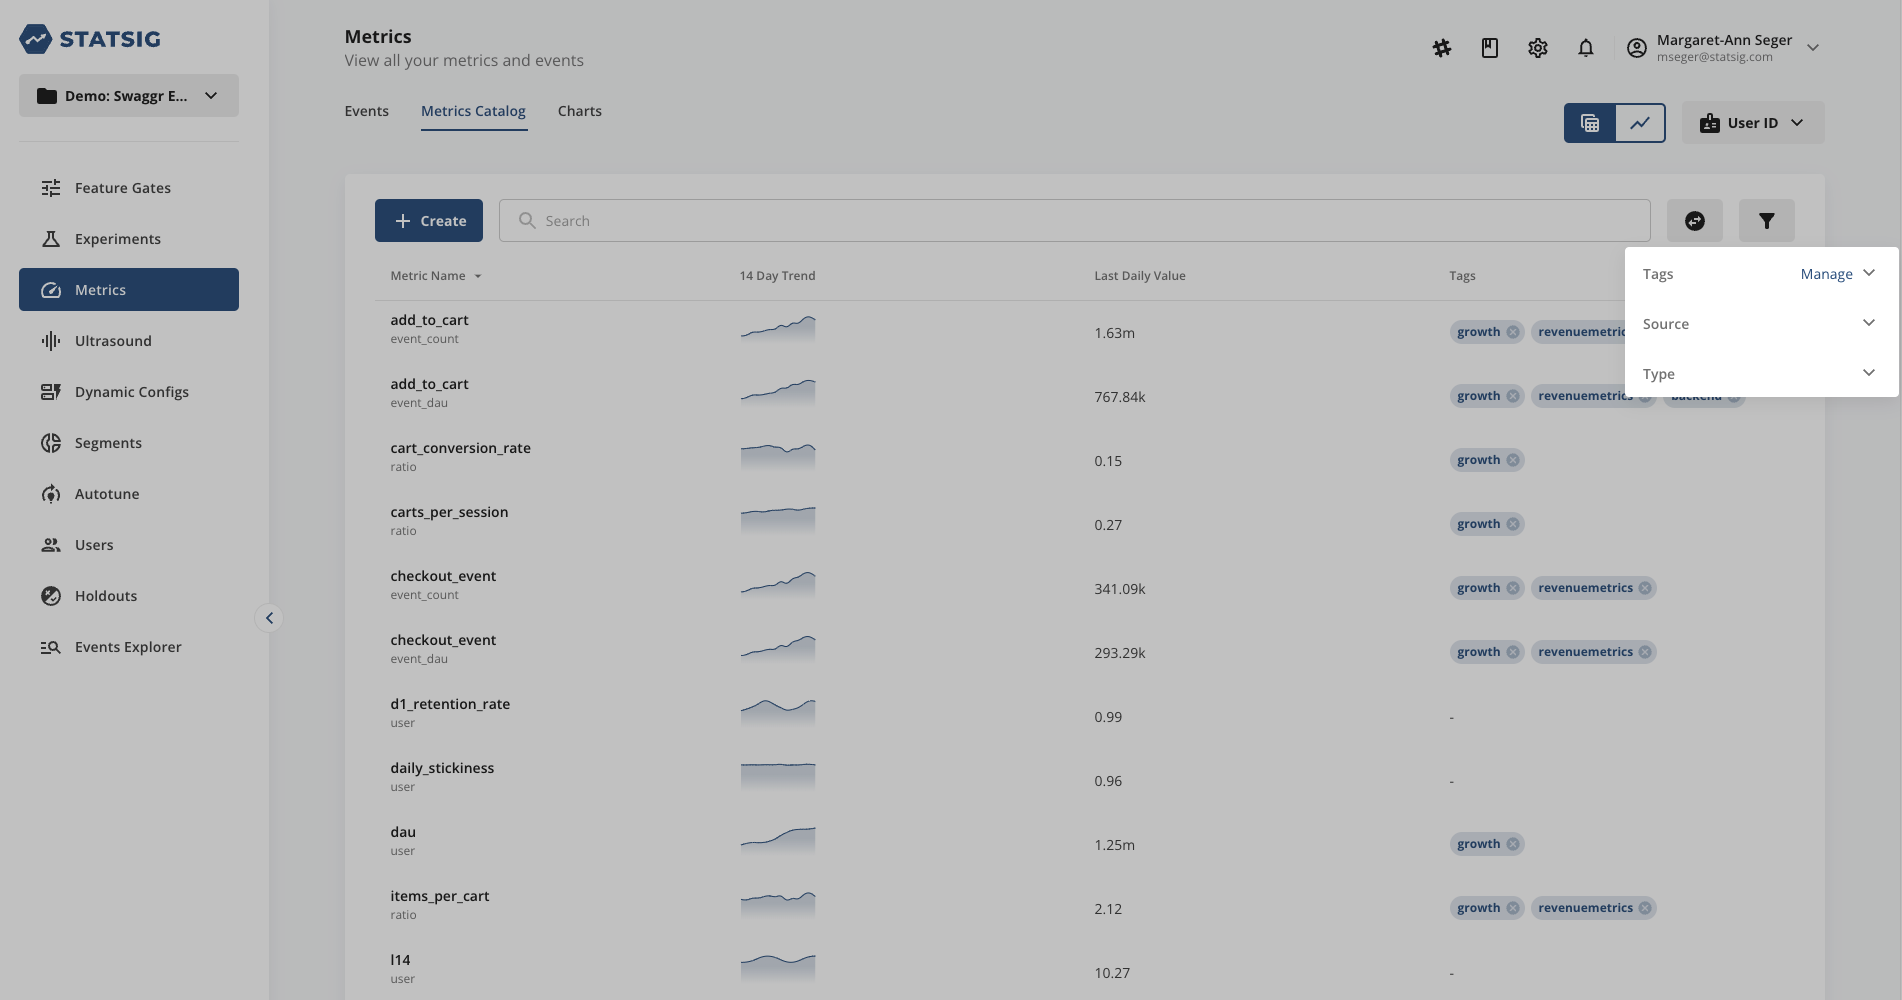 In the **Metrics Catalog** tab, click on the **Tags** filter icon in the upper right-hand corner, and then tap **Manage** in the drop-down. This will take you to the tag manager within Project Settings for all tags in your project.
 Tap on the **Create New Tag** in the upper right-hand corner of the tag manager tab to create a new tag. Enter a name and description for your new tag. Click on **Create**.
 From now on, you can quickly add this tag to any metric using the **+** icon when you hover on the metric. To see what metrics are associated with a given tag, you can reference the **Tags** tab within Project Settings.
 Once you've tagged your metrics, you can zoom into **Metric Lifts** in Pulse for the tagged metrics to focus on the results that matter the most to you.
 ## Core Tag
As part of every Statsig Project, a **Core** tag is auto-created and pre-populated with a subset of your app’s User Metrics. User Metrics are a suite of classic growth metrics, such as MAU, WAU, DAU, L7, 28d retention, etc. that Statsig calculates daily based on your logged events. The following User Metrics are added to the Core tag by default (though you can remove them or swap them for other, more relevant business metrics as needed):
* DAU/ WAU/ MAU
* New users
* Daily/ Weekly/ Monthly user stickiness
The Core tag is meant to serve as a collection of your most important business metrics, which you want to monitor with every new feature rollout and experiment.
The Core tag is automatically added to all new feature gates and experiments at the point of creation. In an experiment, the Core tag is added to the Scorecard, under **Secondary Metrics**. In a feature gate, the Core tag is added to the **Monitoring Metrics** section.
## Configuring your Core Metrics
Given the special treatment the Core tag receives, it is recommended to spend a bit of time curating the set of metrics included in this tag collection at Project set-up. To do this, go to **Metrics** → **Metrics Catalog** and add the **Core** tag to any relevant metrics.
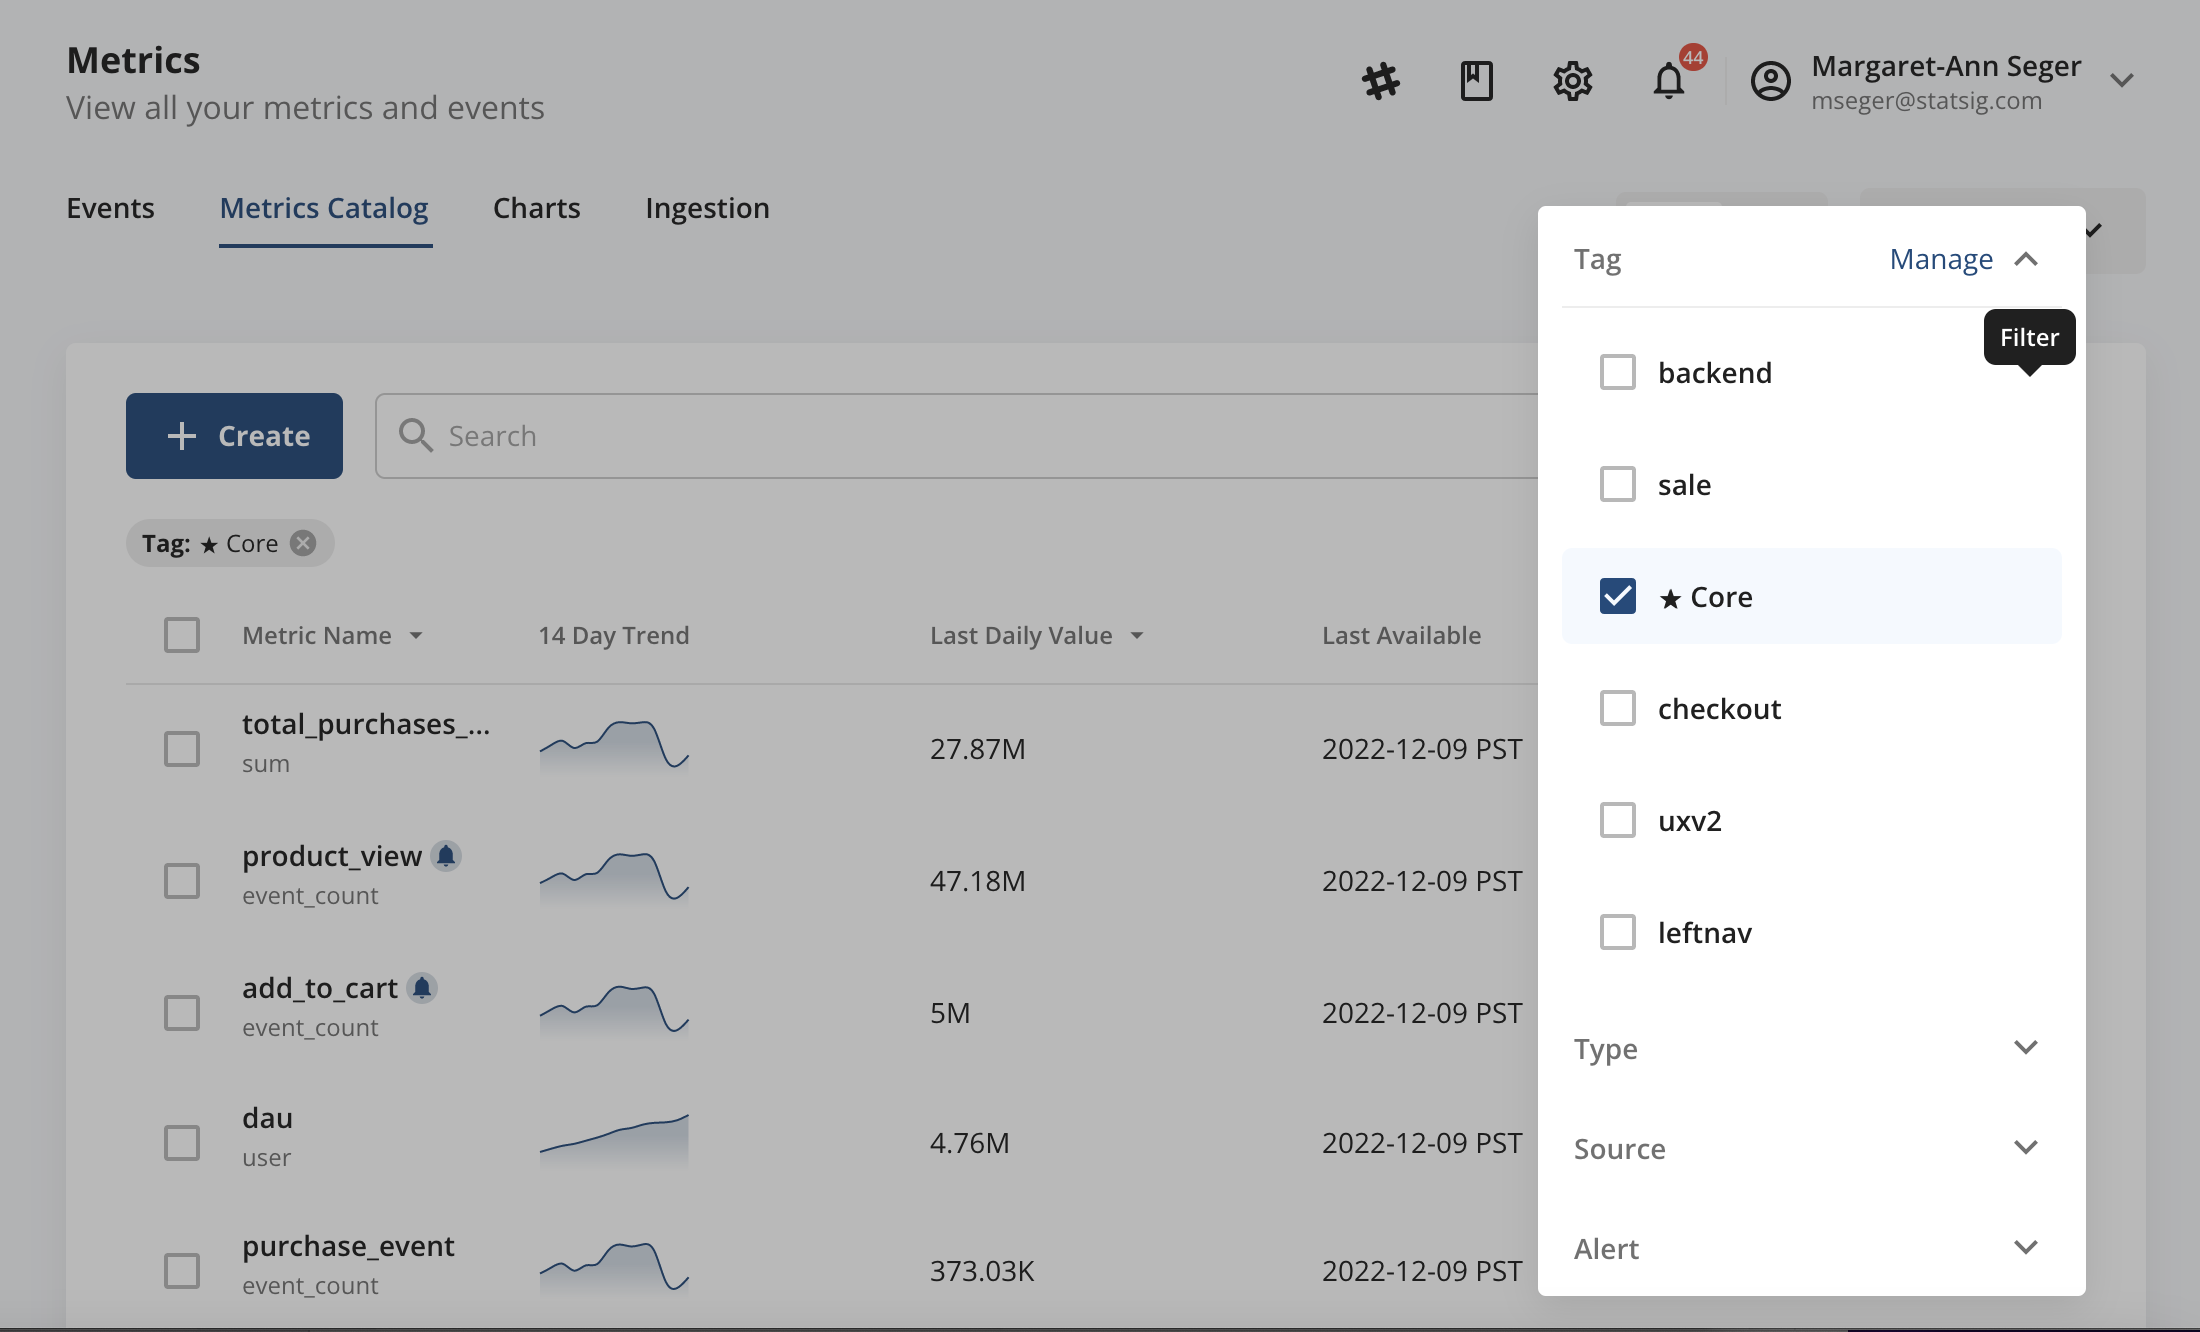
To see which metrics already have the **Core** tag applied, filter by the **Core** tag in the Metrics Catalog by tapping the filter icon in the upper right-hand corner, then **Tags**, then selecting the **Core** tag. Remove the Core tag from any unwanted metrics in the resulting filtered listview.
## Core Tag
As part of every Statsig Project, a **Core** tag is auto-created and pre-populated with a subset of your app’s User Metrics. User Metrics are a suite of classic growth metrics, such as MAU, WAU, DAU, L7, 28d retention, etc. that Statsig calculates daily based on your logged events. The following User Metrics are added to the Core tag by default (though you can remove them or swap them for other, more relevant business metrics as needed):
* DAU/ WAU/ MAU
* New users
* Daily/ Weekly/ Monthly user stickiness
The Core tag is meant to serve as a collection of your most important business metrics, which you want to monitor with every new feature rollout and experiment.
The Core tag is automatically added to all new feature gates and experiments at the point of creation. In an experiment, the Core tag is added to the Scorecard, under **Secondary Metrics**. In a feature gate, the Core tag is added to the **Monitoring Metrics** section.
## Configuring your Core Metrics
Given the special treatment the Core tag receives, it is recommended to spend a bit of time curating the set of metrics included in this tag collection at Project set-up. To do this, go to **Metrics** → **Metrics Catalog** and add the **Core** tag to any relevant metrics.
To see which metrics already have the **Core** tag applied, filter by the **Core** tag in the Metrics Catalog by tapping the filter icon in the upper right-hand corner, then **Tags**, then selecting the **Core** tag. Remove the Core tag from any unwanted metrics in the resulting filtered listview.
 ## Setting Rollout Alert Thresholds for your Core Metrics
Often when rolling out a new feature or experiment, you may want to be notified if any new rollouts or experiments negatively impact a key business metric. Statsig enables you to set Rollout Alerts at the per-metric level, whereby you will be alerted if any currently running experiment or feature gate regresses the metric beyond the set threshold.
Given the importance of Core Metrics, it is recommended to configure Rollout Alerts for Core Metrics via the metrics Catalog. For more on Rollout Alert configuration, see [here](/metrics/rollout-alerts).
## Setting Rollout Alert Thresholds for your Core Metrics
Often when rolling out a new feature or experiment, you may want to be notified if any new rollouts or experiments negatively impact a key business metric. Statsig enables you to set Rollout Alerts at the per-metric level, whereby you will be alerted if any currently running experiment or feature gate regresses the metric beyond the set threshold.
Given the importance of Core Metrics, it is recommended to configure Rollout Alerts for Core Metrics via the metrics Catalog. For more on Rollout Alert configuration, see [here](/metrics/rollout-alerts).